GPU Accelerated Password Cracking in the Cloud: Speed and Cost-Effectiveness
Note: Though this testing was done on Google Cloud and I work at Google, this work and blog post represent my personal work and do not represent the views of my employer.
As a red teamer and security researcher, I occasionally find the need to crack
some hashed passwords. It used to be that John the
Ripper was the go-to tool for the job. With
the advent of GPGPU technologies like CUDA and OpenCL,
hashcat quickly eclipsed John for pure speed.
Unfortunately, graphics cards are a bit hard to come by in
2021. I decided to take a look
at the options for running hashcat on Google Cloud.
There are several steps involved in getting hashcat running with CUDA, and
because I often only need to run the instance for a short period of time, I put
together a
script
to spin up hashcat on a Google Cloud VM. It can either run the benchmark or
spin up an instance with arbitrary flags. It starts the instance but does not
stop it upon completion, so if you want to give it a try, make sure you shut
down the instance when you’re done with it. (It leaves the hashcat job running
in a tmux session for you to examine.)
At the moment, there are 6 available GPU accelerators on Google Cloud, spanning the range of architectures from Kepler to Ampere (see pricing here):
- NVIDIA A100 (Ampere)
- NVIDIA T4 (Turing)
- NVIDIA V100 (Volta)
- NVIDIA P4 (Pascal)
- NVIDIA P100 (Pascal)
- NVIDIA K80 (Kepler)
Performance Results
I chose a handful of common hashes as representative samples across the
different architectures. These include MD5, SHA1, NTLM, sha512crypt, and
WPA-PBKDF2. These represent some of the most common password cracking
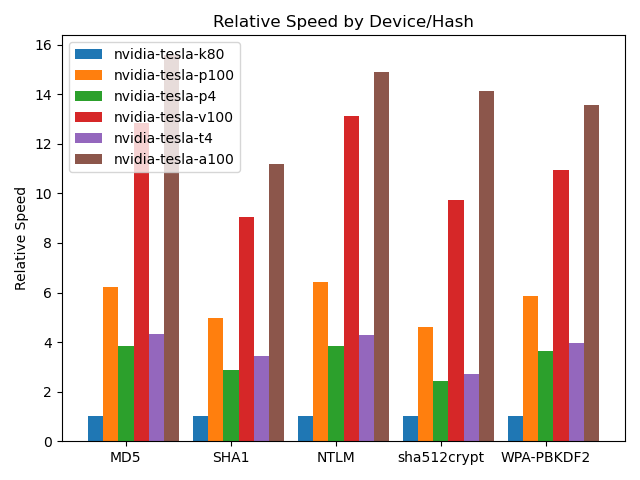
situations encountered by penetration testers. Unsurprisingly, overall
performance is most directly related to the number of CUDA cores, followed by
speed and architecture.
 {:.center}
Speeds in the graph are normalized to the slowest model in each test (the K80 in all cases). {:.caption}
Note that the Ampere-based A100 is 11-15 times as a fast as the slowest K80.
(On some of the benchmarks, it can reach 55 times as fast, but these are less
common.)
There’s a wide range of hardware here, and depending on availability and GPU
type, you can attach from 1 to 16 GPUs to a single instance and hashcat can
spread the load across all of the attached GPUs.
Full results of all of the tests, using the slowest hardware as a baseline for percentages:
| Algorithm | nvidia-tesla-k80 | nvidia-tesla-p100 | nvidia-tesla-p4 | nvidia-tesla-v100 | nvidia-tesla-t4 | nvidia-tesla-a100 | ||||||
|---|---|---|---|---|---|---|---|---|---|---|---|---|
| 0 - MD5 | 4.3 GH/s | 100.0% | 27.1 GH/s | 622.2% | 16.6 GH/s | 382.4% | 55.8 GH/s | 1283.7% | 18.8 GH/s | 432.9% | 67.8 GH/s | 1559.2% |
| 100 - SHA1 | 1.9 GH/s | 100.0% | 9.7 GH/s | 497.9% | 5.6 GH/s | 286.6% | 17.5 GH/s | 905.4% | 6.6 GH/s | 342.8% | 21.7 GH/s | 1119.1% |
| 1400 - SHA2-256 | 845.7 MH/s | 100.0% | 3.3 GH/s | 389.5% | 2.0 GH/s | 238.6% | 7.7 GH/s | 904.8% | 2.8 GH/s | 334.8% | 9.4 GH/s | 1116.7% |
| 1700 - SHA2-512 | 230.3 MH/s | 100.0% | 1.1 GH/s | 463.0% | 672.5 MH/s | 292.0% | 2.4 GH/s | 1039.9% | 789.9 MH/s | 343.0% | 3.1 GH/s | 1353.0% |
| 22000 - WPA-PBKDF2-PMKID+EAPOL (Iterations: 4095) | 80.7 kH/s | 100.0% | 471.4 kH/s | 584.2% | 292.9 kH/s | 363.0% | 883.5 kH/s | 1094.9% | 318.3 kH/s | 394.5% | 1.1 MH/s | 1354.3% |
| 1000 - NTLM | 7.8 GH/s | 100.0% | 49.9 GH/s | 643.7% | 29.9 GH/s | 385.2% | 101.6 GH/s | 1310.6% | 33.3 GH/s | 429.7% | 115.3 GH/s | 1487.3% |
| 3000 - LM | 3.8 GH/s | 100.0% | 25.0 GH/s | 661.9% | 13.1 GH/s | 347.8% | 41.5 GH/s | 1098.4% | 19.4 GH/s | 514.2% | 65.1 GH/s | 1722.0% |
| 5500 - NetNTLMv1 / NetNTLMv1+ESS | 5.0 GH/s | 100.0% | 26.6 GH/s | 533.0% | 16.1 GH/s | 322.6% | 54.9 GH/s | 1100.9% | 19.7 GH/s | 395.6% | 70.6 GH/s | 1415.7% |
| 5600 - NetNTLMv2 | 322.1 MH/s | 100.0% | 1.8 GH/s | 567.5% | 1.1 GH/s | 349.9% | 3.8 GH/s | 1179.7% | 1.4 GH/s | 439.4% | 5.0 GH/s | 1538.1% |
| 1500 - descrypt, DES (Unix), Traditional DES | 161.7 MH/s | 100.0% | 1.1 GH/s | 681.5% | 515.3 MH/s | 318.7% | 1.7 GH/s | 1033.9% | 815.9 MH/s | 504.6% | 2.6 GH/s | 1606.8% |
| 500 - md5crypt, MD5 (Unix), Cisco-IOS $1$ (MD5) (Iterations: 1000) | 2.5 MH/s | 100.0% | 10.4 MH/s | 416.4% | 6.3 MH/s | 251.1% | 24.7 MH/s | 989.4% | 8.7 MH/s | 347.6% | 31.5 MH/s | 1260.6% |
| 3200 - bcrypt $2\*$, Blowfish (Unix) (Iterations: 32) | 2.5 kH/s | 100.0% | 22.9 kH/s | 922.9% | 13.4 kH/s | 540.7% | 78.4 kH/s | 3155.9% | 26.7 kH/s | 1073.8% | 135.4 kH/s | 5450.9% |
| 1800 - sha512crypt $6$, SHA512 (Unix) (Iterations: 5000) | 37.9 kH/s | 100.0% | 174.6 kH/s | 460.6% | 91.6 kH/s | 241.8% | 369.6 kH/s | 975.0% | 103.5 kH/s | 273.0% | 535.4 kH/s | 1412.4% |
| 7500 - Kerberos 5, etype 23, AS-REQ Pre-Auth | 43.1 MH/s | 100.0% | 383.9 MH/s | 889.8% | 186.7 MH/s | 432.7% | 1.0 GH/s | 2427.2% | 295.0 MH/s | 683.8% | 1.8 GH/s | 4281.9% |
| 13100 - Kerberos 5, etype 23, TGS-REP | 32.3 MH/s | 100.0% | 348.8 MH/s | 1080.2% | 185.3 MH/s | 573.9% | 1.0 GH/s | 3123.0% | 291.7 MH/s | 903.4% | 1.8 GH/s | 5563.8% |
| 15300 - DPAPI masterkey file v1 (Iterations: 23999) | 15.6 kH/s | 100.0% | 80.8 kH/s | 519.0% | 50.2 kH/s | 322.3% | 150.9 kH/s | 968.9% | 55.6 kH/s | 356.7% | 187.2 kH/s | 1202.0% |
| 15900 - DPAPI masterkey file v2 (Iterations: 12899) | 8.1 kH/s | 100.0% | 36.7 kH/s | 451.0% | 22.1 kH/s | 271.9% | 79.9 kH/s | 981.4% | 31.3 kH/s | 385.0% | 109.2 kH/s | 1341.5% |
| 7100 - macOS v10.8+ (PBKDF2-SHA512) (Iterations: 1023) | 104.1 kH/s | 100.0% | 442.6 kH/s | 425.2% | 272.5 kH/s | 261.8% | 994.6 kH/s | 955.4% | 392.5 kH/s | 377.0% | 1.4 MH/s | 1304.0% |
| 11600 - 7-Zip (Iterations: 16384) | 91.9 kH/s | 100.0% | 380.5 kH/s | 413.8% | 217.0 kH/s | 236.0% | 757.8 kH/s | 824.2% | 266.6 kH/s | 290.0% | 1.1 MH/s | 1218.6% |
| 12500 - RAR3-hp (Iterations: 262144) | 12.1 kH/s | 100.0% | 64.2 kH/s | 528.8% | 20.3 kH/s | 167.6% | 102.2 kH/s | 842.3% | 28.1 kH/s | 231.7% | 155.4 kH/s | 1280.8% |
| 13000 - RAR5 (Iterations: 32799) | 10.2 kH/s | 100.0% | 39.6 kH/s | 389.3% | 24.5 kH/s | 240.6% | 93.2 kH/s | 916.6% | 30.2 kH/s | 297.0% | 118.7 kH/s | 1167.8% |
| 6211 - TrueCrypt RIPEMD160 + XTS 512 bit (Iterations: 1999) | 66.8 kH/s | 100.0% | 292.4 kH/s | 437.6% | 177.3 kH/s | 265.3% | 669.9 kH/s | 1002.5% | 232.1 kH/s | 347.3% | 822.4 kH/s | 1230.8% |
| 13400 - KeePass 1 (AES/Twofish) and KeePass 2 (AES) (Iterations: 24569) | 10.9 kH/s | 100.0% | 67.0 kH/s | 617.1% | 19.0 kH/s | 174.8% | 111.2 kH/s | 1024.8% | 27.3 kH/s | 251.2% | 139.0 kH/s | 1281.0% |
| 6800 - LastPass + LastPass sniffed (Iterations: 499) | 651.9 kH/s | 100.0% | 2.5 MH/s | 390.4% | 1.5 MH/s | 232.2% | 6.0 MH/s | 914.8% | 2.0 MH/s | 304.7% | 7.6 MH/s | 1160.0% |
| 11300 - Bitcoin/Litecoin wallet.dat (Iterations: 200459) | 1.3 kH/s | 100.0% | 5.0 kH/s | 389.9% | 3.1 kH/s | 241.5% | 11.4 kH/s | 892.3% | 4.1 kH/s | 325.3% | 14.4 kH/s | 1129.2% |
Value Results
Believe it or not, speed doesn’t tell the whole story, unless you’re able to bill the cost directly to your customer – in that case, go straight for that 16-A100 instance. :)
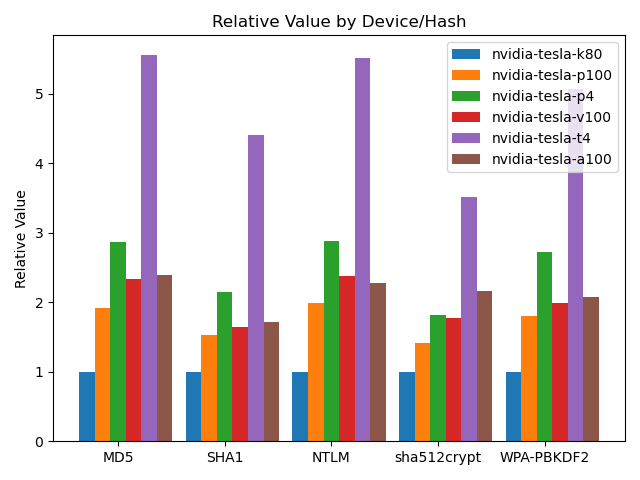
You’re probably more interested in value however – that is, hashes per
dollar. This is computed based on the speed and price per hour, resulting in
hash per dollar value. For each card, I computed the median relative
performance across all of the hashes in the default hashcat benchmark. I then
divided performance by price per hour, then normalized these values again.
 {:.center}
Relative value is the mean speed per cost, in terms of the K80. {:.caption}
| Card | Performance | Price | Value |
|---|---|---|---|
| nvidia-tesla-k80 | 100.0 | $0.45 | 1.00 |
| nvidia-tesla-p100 | 519.0 | $1.46 | 1.60 |
| nvidia-tesla-p4 | 286.6 | $0.60 | 2.15 |
| nvidia-tesla-v100 | 1002.5 | $2.48 | 1.82 |
| nvidia-tesla-t4 | 356.7 | $0.35 | 4.59 |
| nvidia-tesla-a100 | 1341.5 | $2.93 | 2.06 |
Though the NVIDIA T4 is nowhere near the fastest, it is the most efficient in terms of cost, primarily due to its very low $0.35/hr pricing. (At the time of writing.) If you have a particular hash to focus on, you may want to consider doing the math for that hash type, but the relative performances seem to have the same trend. It’s actually a great value.
So maybe the next time you’re on an engagement and need to crack hashes, you’ll be able to figure out if the cloud is right for you.