Lessons Learned from SSH Credential Honeypots
For the past few months, I’ve been running a handful of SSH Honeypots on some cloud providers, including Google Cloud, DigitalOcean, and NameCheap. As opposed to more complicated honeypots looking at attacker behavior, I decided to do something simple and was only interested in where they were coming from, what tools might be in use, and what credentials they are attempting to use to authenticate. My dataset includes 929,554 attempted logins over a period of a little more than 3 months.
If you’re looking for a big surprise, I’ll go ahead and let you down easy: my analysis hasn’t located any new botnets or clusters of attackers. But it’s been a fascinating project nonetheless.
Honeypot Design
With a mere 200ish lines of Go, I implemented a honeypot server using the
golang.org/x/crypto/ssh
library as the underlying implementation. I advertised a portable OpenSSH
version as the server version string (sent to clients on connection). I then
logged each connection to a SQLite database, including the timestamp, IP
address, client version, and credentials used to (attempt to) authenticate.
Analysis of Credentials
In a surprise to absolutely nobody, root is by far the most commonly tried
username for login sessions. I suspect there must be many attackers trying
lists of passwords with just root as the username, as 78% of attempted logins
were with username root. None of the remainder of the top 10 are particularly
surprising, although usuario was not one I expected to see. (It is Spanish
for user.)
Blank passwords are the most common attempted passwords, followed by other
obvious choices, like 123456 and password. Just off the top 10 list was a
surprising choice of password: J5cmmu=Kyf0-br8CsW. Interestingly, a Google
search for this password only finds other people with experience running
credential honeypots. It doesn’t appear in any of the password wordlists I
have, including SecLists and
others. If anyone knows what this is a password for, I’d love to know.
There were a number of other interesting passwords such as 7ujMko0admin, used
for a bunch of networked DVRs, and also known to be used by malware attacking
IoT devices. There are other passwords that don’t look obvious to a US-centric
view of the world, like:
baikal– a lake in Siberiaprueba– Spanish for testcaonima– a Mandarin profanity written in Pinyinmeiyoumima– Mandarin for “no password”woaini– Mandarin for “I love you”poiuyt– The name for an optical illusion also known as the “devil’s tuning fork”
There are also dozens and dozens of keyboard walks, like 1q2w3e, 1qaz@WSX,
and !QAZ2wsx. There are many more that took me much longer to realize they
were keyboard walks, such as 4rfv$RFV and qpwoei.
It has actually fascinated me to look at some of the less obvious passwords and discern their background. Many are inexplicable, but I assume they are from hardcoded passwords in devices or something along those lines. Or perhaps someone let their cat walk across the keyboard to generate it. I’ve certainly had that experience.
Overall, the top 10 usernames and top 10 passwords (not necessarily together) are:
|———-|——|———-|——|
| Username | Count | Password | Count |
|---|---|---|---|
root | 729108 | <blank> | 40556 |
admin | 23302 | 123456 | 14542 |
user | 8420 | admin | 7757 |
test | 7547 | 123 | 7355 |
oracle | 6211 | 1234 | 7099 |
ftpuser | 4012 | root | 6999 |
ubuntu | 3657 | password | 6118 |
guest | 3606 | test | 5671 |
postgres | 3455 | 12345 | 5223 |
usuario | 2876 | guest | 4423 |
| ———- | —— | ———- | —— |
| {:.center} |
There were a total of 128,588 unique pairings of username and password attempted, though only 38,112 were attempted 5 or more times. You can download the full list of pairs with counts here, but I’ve omitted those attempted less than 5 times in case a legitimate user typo’d an IP or otherwise was mistaken. The top 25 pairings are:
|———-|————|——-|
| username | password | count |
|---|---|---|
| root | 37580 | |
| root | root | 4213 |
| user | user | 2794 |
| root | 123456 | 2569 |
| test | test | 2532 |
| admin | admin | 2531 |
| root | admin | 2185 |
| guest | guest | 2143 |
| root | password | 2128 |
| oracle | oracle | 1869 |
| ubuntu | ubuntu | 1811 |
| root | 1234 | 1681 |
| root | 123 | 1658 |
| postgres | postgres | 1594 |
| support | support | 1535 |
| jenkins | jenkins | 1360 |
| admin | password | 1241 |
| root | 12345 | 1177 |
| pi | raspberry | 1160 |
| root | 12345678 | 1126 |
| root | 123456789 | 1069 |
| ubnt | ubnt | 1069 |
| admin | 1234 | 1012 |
| root | 1234567890 | 967 |
| ec2-user | ec2-user | 963 |
| ———- | ———— | ——- |
| {:.center} |
Again, no real surprises here. ubnt is a little bit higher than I would have
thought (for Ubiquiti networking gear) but I suppose there’s a fair bit of their
gear on the internet. It’s interesting to see the mix of “lazy admin” and
“default credentials” here. It’s mildly interesting to me that all substrings
of the first 10 digits (3 or longer) are included, except for 7 digits. I
guess 7 digit passwords are less common?
Timing Information
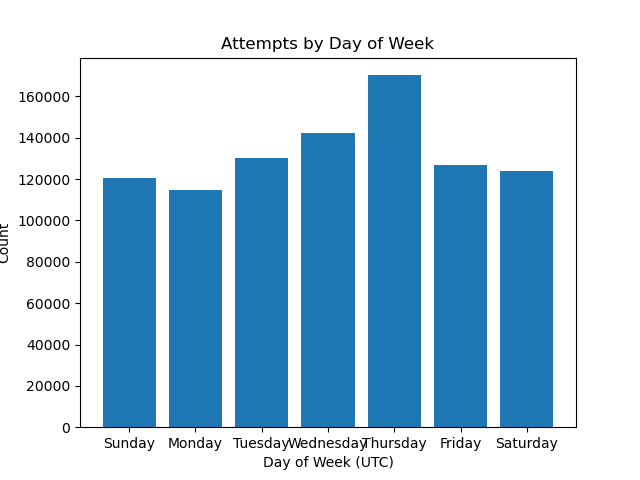
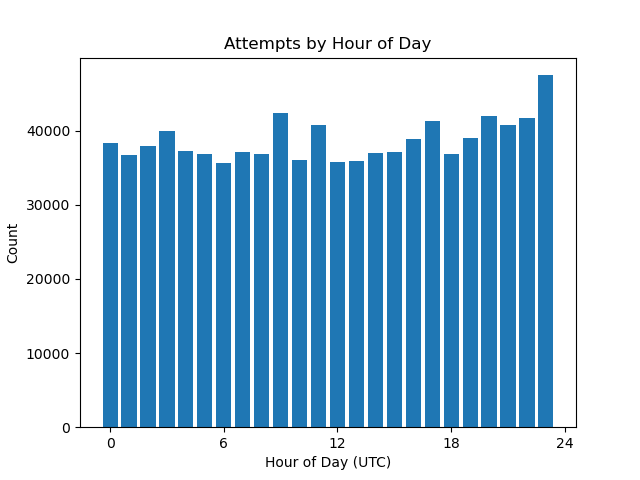
Though I imagine these kind of untargeted scans are long-term processes continually running, I decided to check and see what the timing looked like anyway. Neither the day of week analysis nor the hour of day analysis look like there’s any significant variance.
 {:.center}
 {:.center}
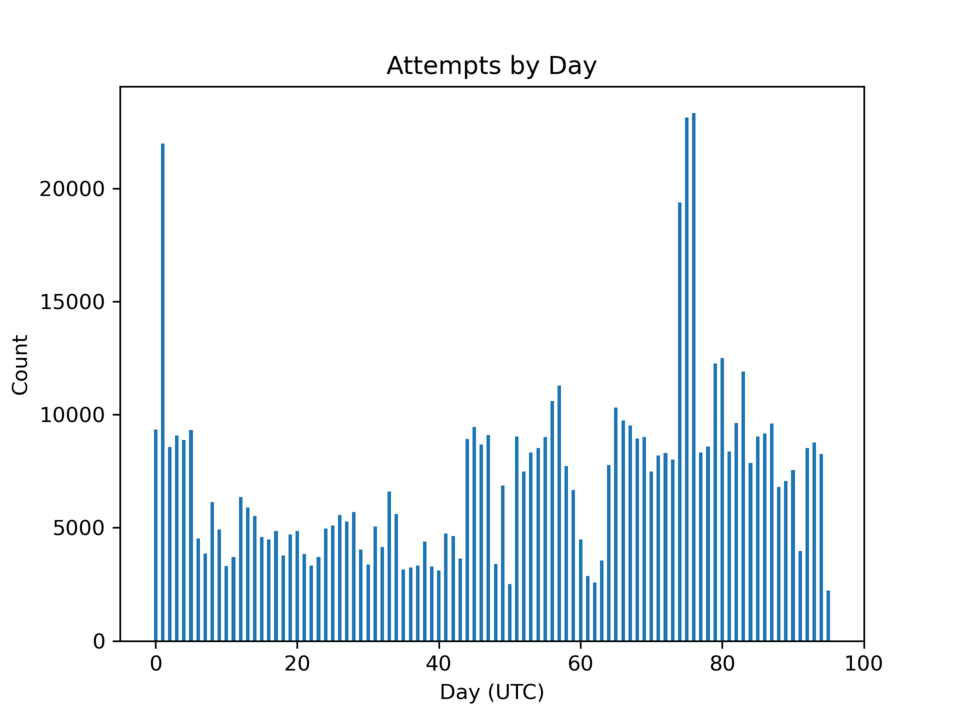
Looking at the number of login requests over the time period where I’ve been running the honeypots shows the traffic to be intermittent. While I didn’t expect the number to be constant, the variance is much higher than I expected. I imagine a larger sample size and more nodes would probably make the results more even.
 {:.center}
Analysis of Sources
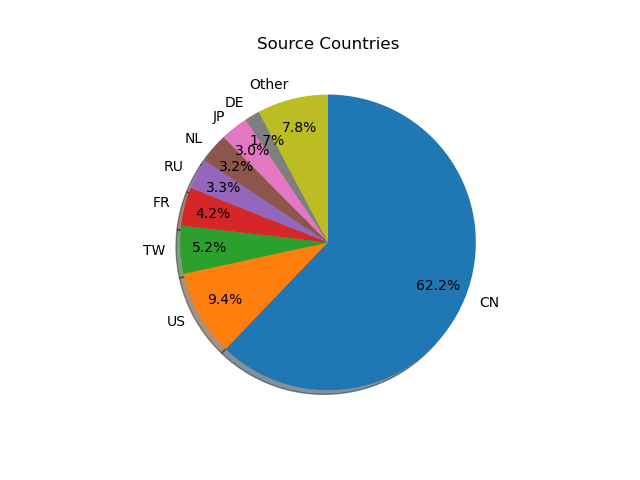
So where are all of these requests coming from? I want to start by noting that none of my analysis is an attempt to attribute the actors making the requests – that’s just not possible with this kind of data. There’s two ways to look at the source of requests – in terms of the network, and in terms of the (assumed) geography. My analysis relied on the IP to ASN and IP to Country data provided by iptoasn.com.
Looking at the country-level data, networks from China lead the pack by a long shot (62% of all login attempts), followed by the US.
 {:.left}
|———-|——–|
| Country | Count |
|---|---|
| CN | 577789 |
| US | 87589 |
| TW | 48645 |
| FR | 39072 |
| RU | 30929 |
| NL | 29920 |
| JP | 28033 |
| DE | 15408 |
| IN | 13921 |
| LT | 6623 |
| ———- | ——– |
| {:.right} |
Again, I’m not claiming that these countries mean anything other than location of the autonomous system (AS) that originates the requests. I also did not do individual IP geolocation, so the results should be taken with a small grain of salt.
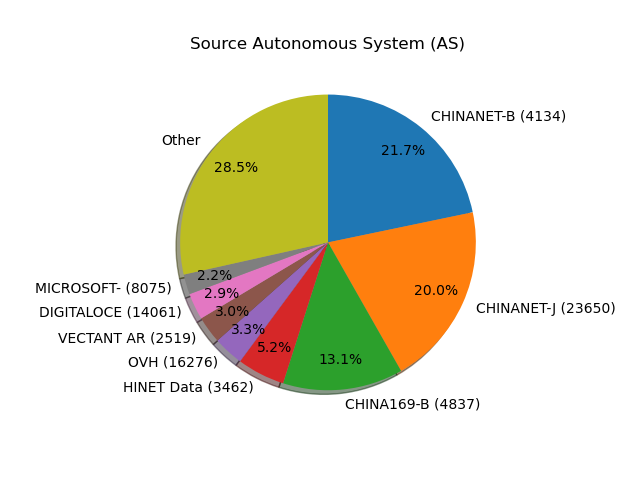
So what networks are sourcing this traffic? I have the full AS counts and data, but the top networks are:
| AS Name | Country | ASN | Count |
|---|---|---|---|
| CHINANET-BACKBONE No.31,Jin-rong Street | CN | 4134 | 202024 |
| CHINANET-JS-AS-AP AS Number for CHINANET jiangsu province backbone | CN | 23650 | 186274 |
| CHINA169-BACKBONE CNCGROUP China169 Backbone | CN | 4837 | 122192 |
| HINET Data Communication Business Group | TW | 3462 | 48492 |
| OVH | FR | 16276 | 30865 |
| VECTANT ARTERIA Networks Corporation | JP | 2519 | 27481 |
| DIGITALOCEAN-ASN - DigitalOcean, LLC | US | 14061 | 26965 |
| MICROSOFT-CORP-MSN-AS-BLOCK - Microsoft Corporation | US | 8075 | 20370 |
| RMINJINERING | RU | 49877 | 16710 |
| AS38994 | NL | 38994 | 14482 |
| XMGBNET Golden-Bridge Netcom communication Co.,LTD. | CN | 45058 | 12418 |
| CNNIC-ALIBABA-CN-NET-AP Hangzhou Alibaba Advertising Co.,Ltd. | CN | 37963 | 12045 |
| CNNIC-TENCENT-NET-AP Shenzhen Tencent Computer Systems Company Limited | CN | 45090 | 10804 |
| CNIX-AP China Networks Inter-Exchange | CN | 4847 | 10000 |
| PONYNET - FranTech Solutions | US | 53667 | 9317 |
| ITTI | US | 44685 | 7960 |
| CHINA169-BJ China Unicom Beijing Province Network | CN | 4808 | 7835 |
| AS12876 | FR | 12876 | 7262 |
| AS209605 | LT | 209605 | 6586 |
| CONTABO | DE | 51167 | 6261 |
| {:.center} |
 {:.center}
Chinanet is no surprise given the high ratio of China in general. OVH is a low-cost host known to have liberal AUP, so is popular for both malicious and research purposes. DigitalOcean and Microsoft, of course, are popular cloud providers. Surprisingly, AWS only sourced about 600 connections, unless they have a large number of IPs on a non-Amazon ASN.
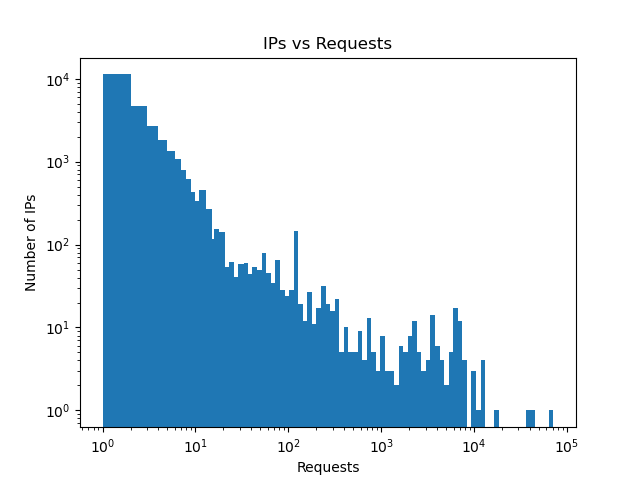
Overall, traffic came from 27,448 unique IPv4 addresses. Of those, more than 11 thousand sent only a single request. At the other end of the spectrum, the top IP source sent 64,969 login requests.
Most hosts sent relatively few requests, the large numbers are outliers:
 {:.center}
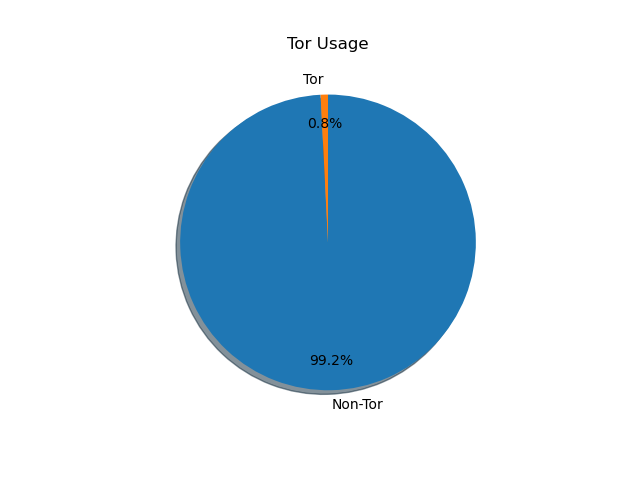
Surely, by now a thought has crossed your mind: how many of these requests are coming from Tor? Surely the Tor network is a wretched hive of scum and villany, and the source of much malicious traffic, right?
 {:.center}
Not at all. Only 219 of the unique source IPs were identified as Tor exit nodes, representing only 0.8% of the sources. On a per-request basis, even a smaller percentage of requests is seen from Tor exit nodes.
Client Software
Remember – this is self-reported by the client application, and just like I can spoof the server version string, so can clients. But I still thought it would be interesting to take a brief look at those.
|——————————————-|——–|
| client | count |
|---|---|
SSH-2.0-PuTTY | 309797 |
SSH-2.0-PUTTY | 182465 |
SSH-2.0-libssh2_1.4.3 | 135502 |
SSH-2.0-Go | 125254 |
SSH-2.0-libssh-0.6.3 | 62117 |
SSH-2.0-libssh2_1.7.0 | 23799 |
SSH-2.0-libssh2_1.9.0 | 21627 |
SSH-2.0-OpenSSH_7.3 | 9954 |
SSH-2.0-OpenSSH_7.4p1 | 8949 |
SSH-2.0-libssh2_1.8.0 | 5284 |
SSH-2.0-JSCH-0.1.45 | 3469 |
SSH-2.0-PuTTY_Release_0.70 | 2080 |
SSH-2.0-PuTTY_Release_0.63 | 1813 |
SSH-2.0-OpenSSH_5.3 | 1212 |
SSH-2.0-paramiko_1.8.1 | 1140 |
SSH-2.0-PuTTY_Release_0.62 | 1130 |
SSH-2.0-OpenSSH_4.3 | 795 |
SSH-2.0-PuTTY_Release_0.66 | 694 |
SSH-2.0-OpenSSH_7.9p1 Raspbian-10+deb10u2 | 690 |
SSH-2.0-libssh_0.11 | 660 |
| ——————————————- | ——– |
| {:.center} |
You know, I didn’t expect that. PuTTY as the top client strings. (Also not sure what to make of the case difference.) I wonder if people are building the PuTTY SSH library into a tool for scanning or wrapping the binary in some kind of script.
Go, paramiko, and libssh are less surprising, as they’re libraries designed for integration. It’s hard to know if the OpenSSH requests are linked into a scanning tool or just wrapped versions of the SSH client. At some point in the future, I might dive more into this and trying to figure out which software uses which libraries (at least for the publicly-known tools).
Summary
I was hoping to find something earth-shattering in this research. Instead, I found things that were much as expected – common usernames and passwords, widespread scanning, large numbers of requests. One thing’s for sure though: connect it to the internet and someone’s going to pwn it.